In this project, we need to decide if a new bank customer is approved for loan or not using a predictive model.
Project overview
We have the following information to work with:
- Data on all past applications for a loan
- The list of customers that need to be classified
Because we are classifying new customers to two groups: creditworthy or not - we need to use a binary model to make this decision. We will build and compare classification models such as Logistic Regression, Decision Tree, Random Forest, and Boosted Model models’ performance against each other. Then decide on the best model to classify new bank customers on whether they can be approved for a loan or not.
Step 1: Data clean up and building the Training Set
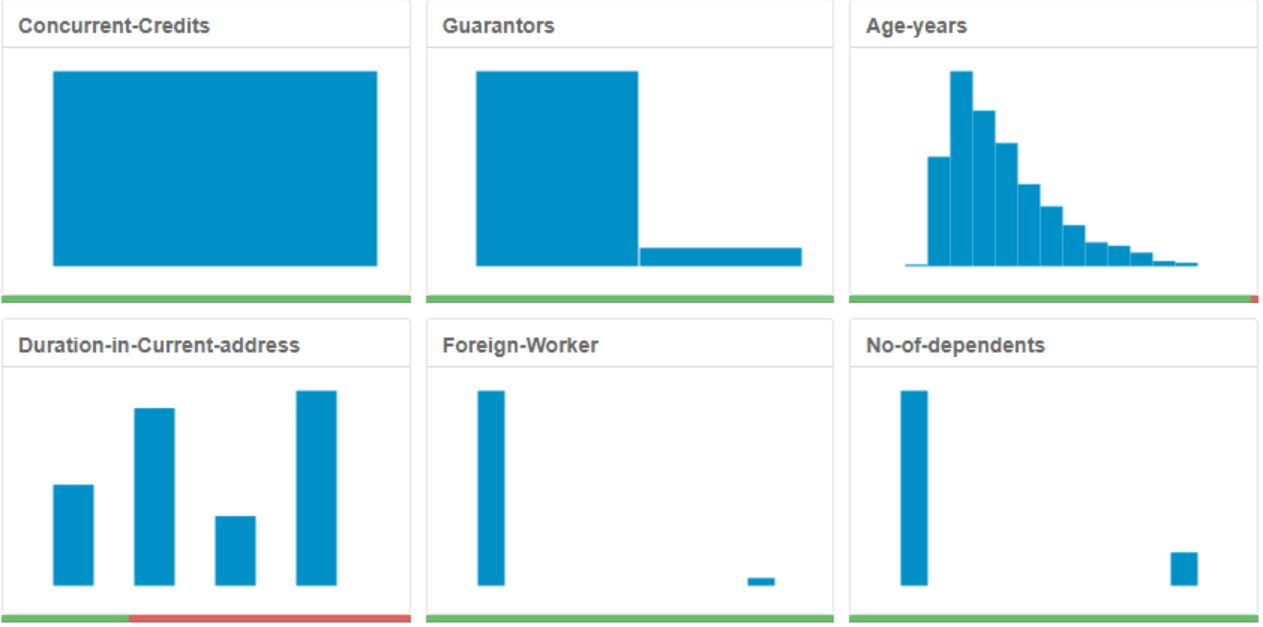
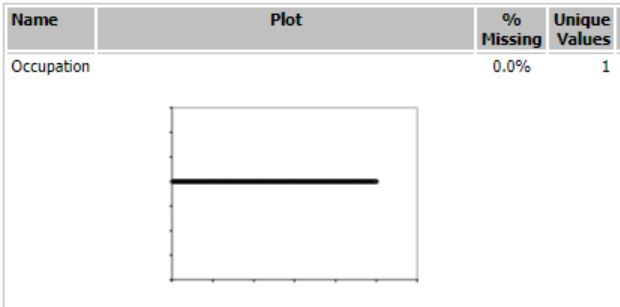
I used Field Summary tool to explore given dataset in Alteryx. Based on report below following decisions were made: Duration in Current Address has 69% missing data and was removed, while Age Years has missing data as well, but only 2.4% which I decided to impute the missing values with median age because median is not affected by outliers. There were two fields with just one value for the whole field: Occupation and Concurrent Credits. Other fields with low-variability where more than 80% of the data was skewed to one side: Guarantors, Number of Dependants and Foreign Worker. All these fields were removed. And lastly Telephone field was removed because it is irrelevant to customer’s credit worth.
Step 2: Training the Classification Models
For creating estimation and validation samples 70% went for estimation(training sample) and 30% of the entire dataset was saved for validation. For each model I have highlighted their significant predictor variables with their p-values.
- Logistic Regression model
Logistic regression model with Stepwise kept these predictor variables:
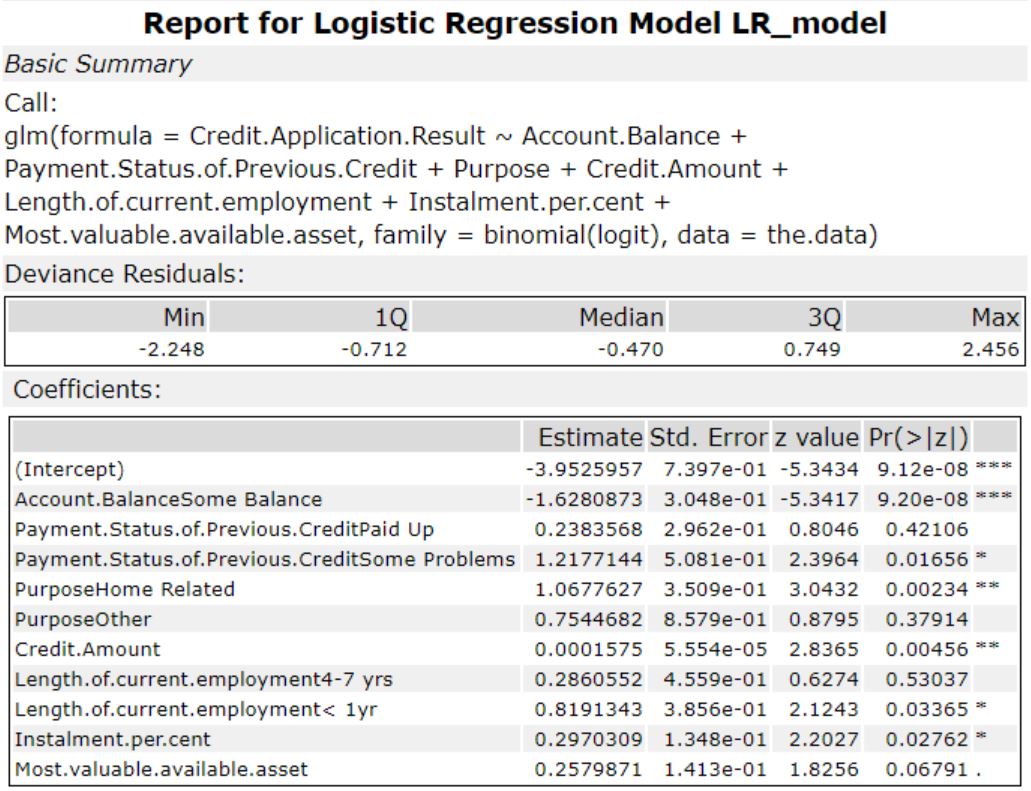
- Account balance
- Payment status
- Purpose
- Credit amount
- Length of current employment
- Instalment percent
- Decision Tree model Decision Tree model found these predictor variables significant:
- Account Balance
- Value Savings Stocks
- Duration of Credit in Months
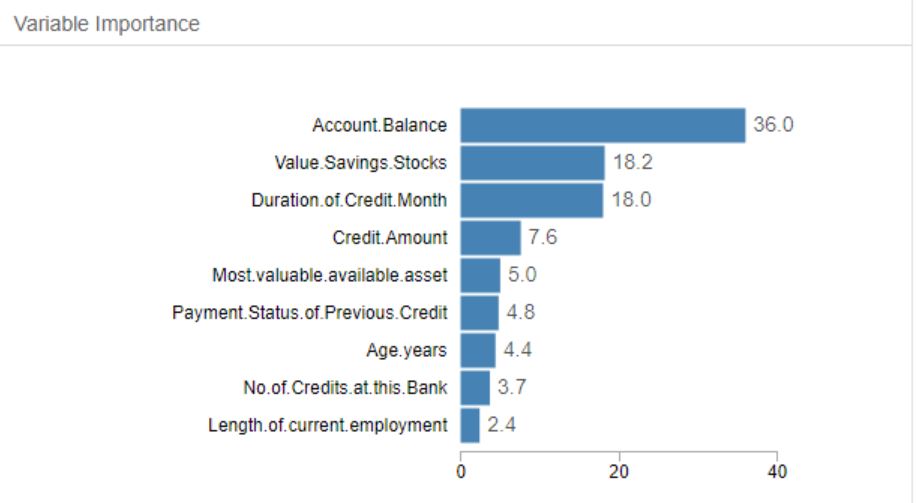
- Forest Model
The Forest model found these predictor variables most significant:
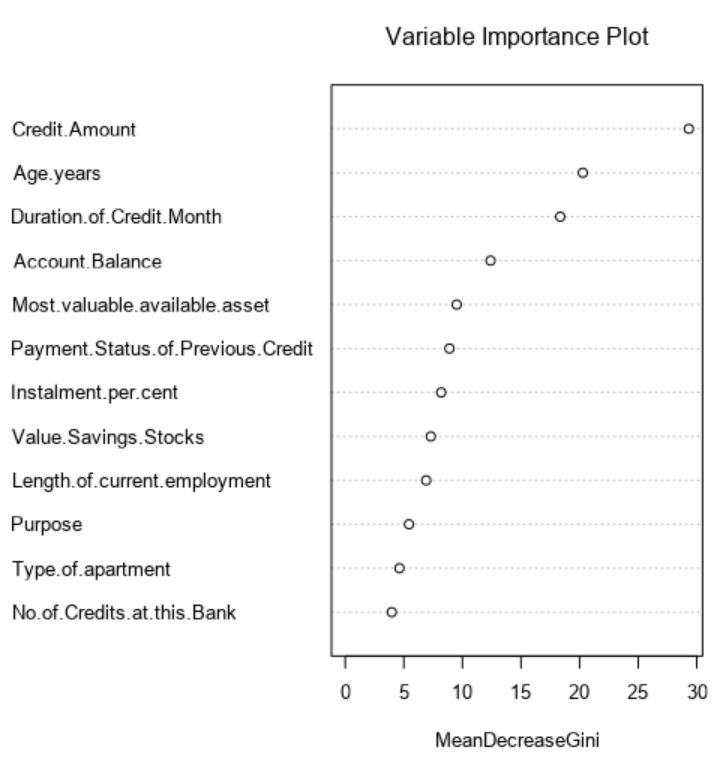
- Credit Amount
- Age in years
- Duration of credit in months
- Account Balance
- Boosted Model
Our Boosted Model works with these predictor variables:
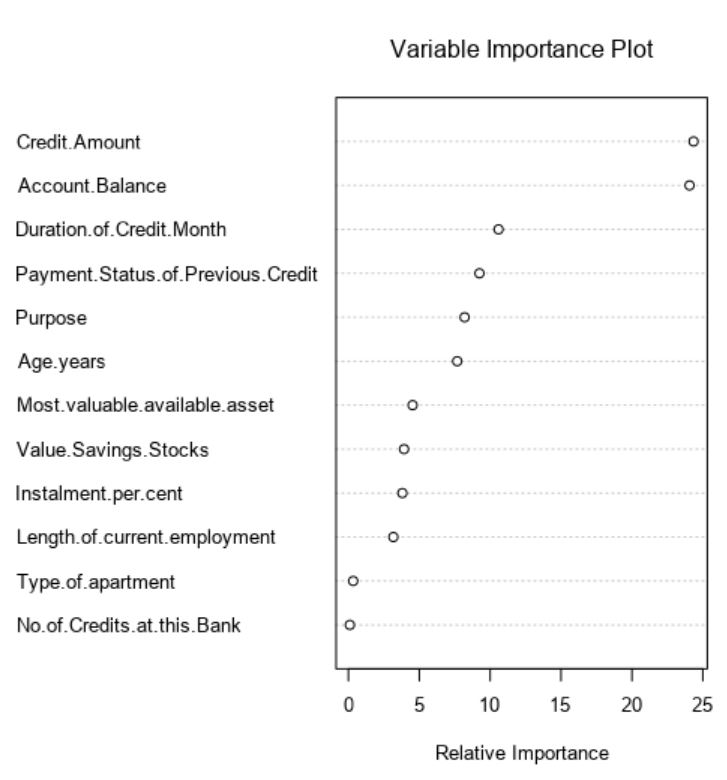
- Credit amount
- Account balance
- Duration of credit in months
- Payment status of previous credit
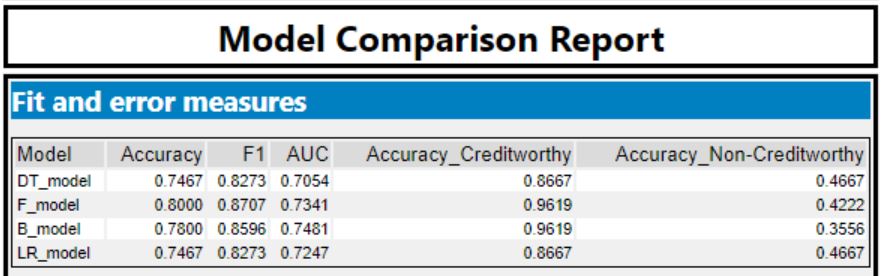
Step 3: Model accuracy comparison against validation set
The Regression and the Decision Tree models predicted a lot of creditworthy applicants as non-creditworthy. Those two models are predicting the creditworthy applicants with more accuracy compared to the non-creditworthy. We can see that the Positive Predictive value (PPV, also called Precision) is higher than the Negative Predictive Value (NPV) which suggests that the models are biased towards creditworthy applicants which is understandable since our data set is biased - having a lot more creditworthy than non-creditworthy applicants.
Decision tree and regression model both: PPV 79%, NPV 60%.
Boosted model: PPV 77%, NPV 80%.
Forest model: PPV 80%, NPV 83%.
The PPV and NPV are almost equal in Boosted and Forest models - suggesting lack of bias.
Step 4: Choosing the best model
I chose to use our Forest model to predict loan worthy customers taking into account its highest overall accuracy compared to other models and its high F1 score, which looks for the bias in prediciting “Creditworthy” or “Non-Creditworthy” and calculates a single score: the higher the score, the better. Our Forest model’s overall accuracy is 80%, F1 87%.
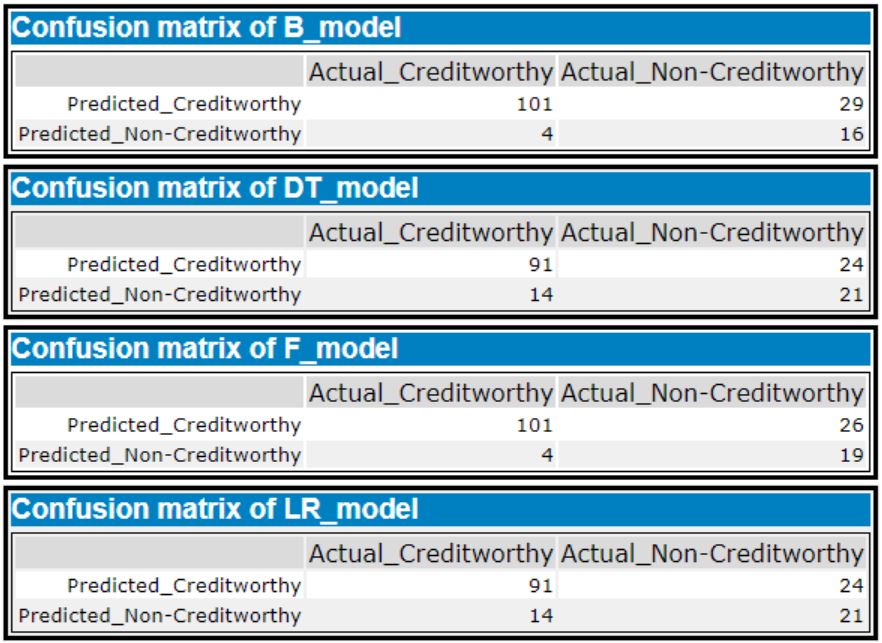
PPV = True Positives / ( True Positives + False Positives ) = 101/ (101 + 26) = 0.8
NPV = True Negatives / ( True Negatives + False Negatives) = 19 / ( 19 + 4) = 0.83
ACC = (TP + TN) / (P + N) = (101 + 19) / (127 + 23) = 0.8
F1 = 2TP / (2TP + FP + FN) = 2x101/ (2x101 + 26 + 4) = 0.87
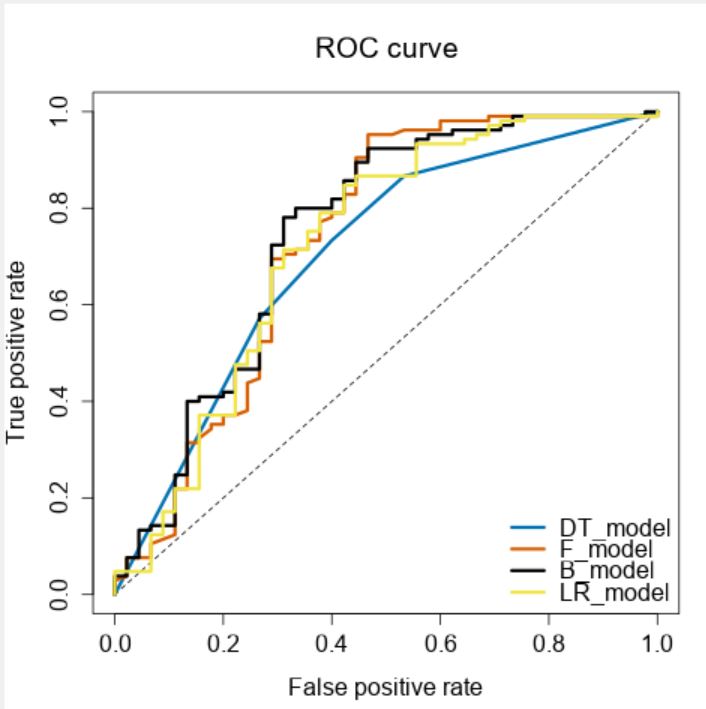
Our Forest model’s AUC is 0.73 it means there is 73% chance that model will be able to distinguish between positive class and negative class.
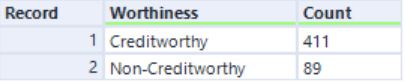
The result
Out of 500 new applications there are 411 customers who are creditworthy meaning they qualify for getting a loan as per our prediction model.
Materials used:
“Understanding AUC - ROC Curve”
https://towardsdatascience.com/understanding-auc-roc-curve-68b2303cc9c5
“Simple guide to confusion matrix terminology”
https://www.dataschool.io/simple-guide-to-confusion-matrix-terminology/
“Confusion matrix online calculator”
http://onlineconfusionmatrix.com/
Alteryx workflows:
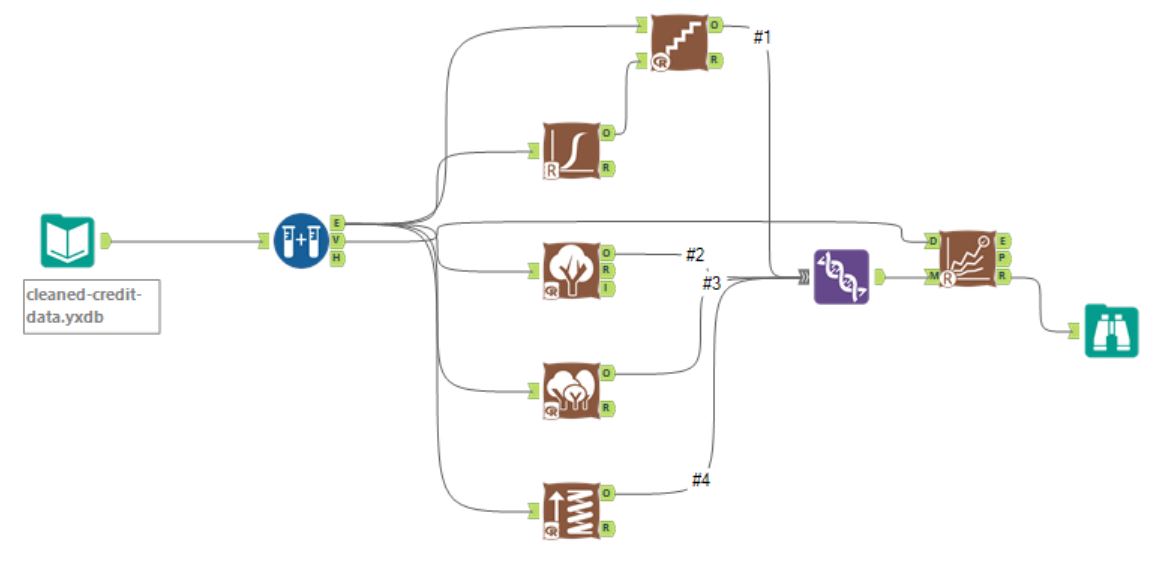 Model comparison workflow
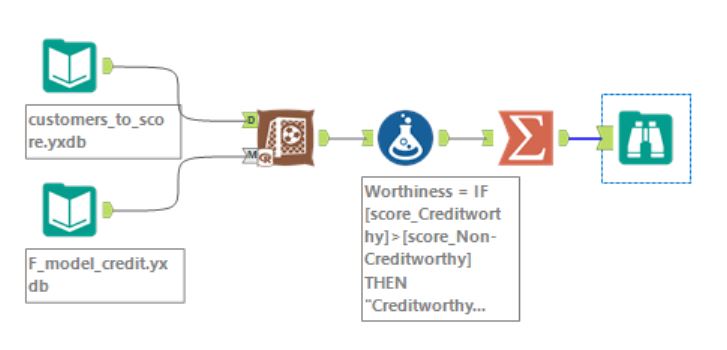 Scoring data with Forest model