
Here we will go through a supermarket transaction data to understand better our customer segments and their purchasing behaviors. The data and task is from a data analytics virtual work experience program I completed with Forage and Quantium, a leading data science and AI Firm with a track record of innovation in data science.
Code for this project is available on my github.
Overview
These tasks work through a common narrative, designed to replicate life in the Retail Analytics and Strategy team at Quantium.
Quantium has had a data partnership with a large supermarket brand for the last few years who provide transactional and customer data. We are goung through this problem as an analyst within the Quantium analytics team and are responsible for delivering highly valued data analytics and insights to help the business make strategic decisions.
The task
We need to analyse the data to understand current purchasing trends and behaviours. The client is particularly interested in customer segments and their chip purchasing behaviour.
Our insights need to have a commercial application as our end goal is to form a strategy based on the findings to provide a clear recommendation to the Category Manager.
Pre-processing
We will start with pre-processing our data before we get into analysing customer segments and sales.
High level data checks:
- summaries of the data
- find outliers and removing these
- Check data formats and correct
Derive extra features:
- pack size
- brand name
Examine:
- inconsistencies
- missing data
- correctly identified category items
Explore date
Straight away we see that date is in a strange format. This is an old excel date format of days after 30/12/1899. We will convert it to a regular date.
First day: 2018-07-01 00:00:00
Last day: 2019-06-30 00:00:00
Number of unique dates: 364
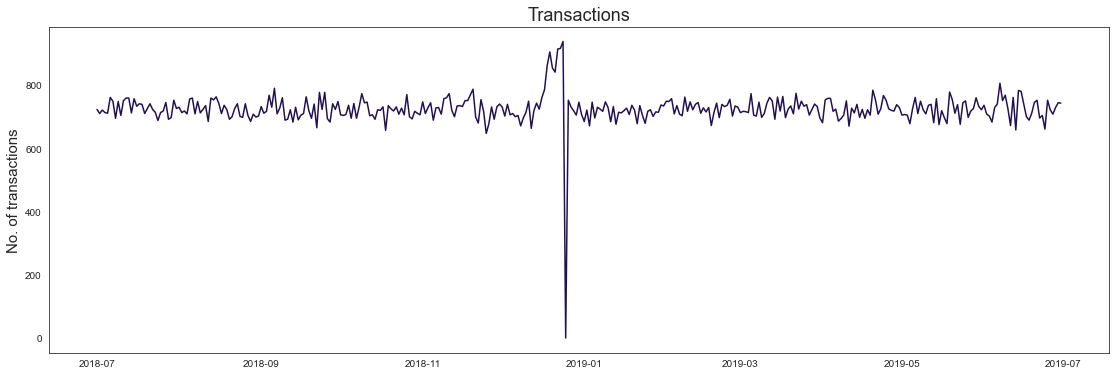
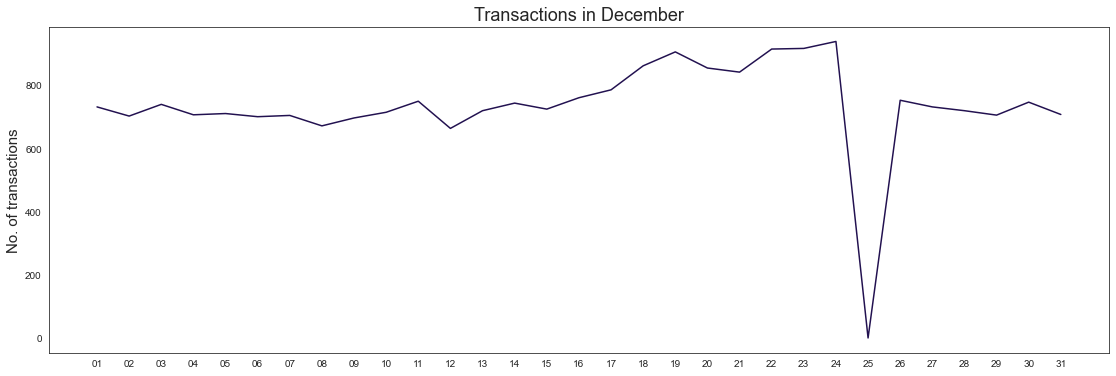
Looks like transactions from one day are missing (as there are usually 365 days per year and we found records for only 364 days.) The missing date is Christmas day December 25th 2018, when the shop is closed so it is not an anomaly.
Number of transactions over time
Closer look at December
Derive features
Weight
Because the weight of the product is attached to it’s product name, we will need to extract the weight from each product name to a new column.
| Product name | |
|---|---|
| 97 | Cheetos Puffs 165g |
| 5 | Kettle 135g Swt Pot Sea Salt |
| 57 | Burger Rings 220g |
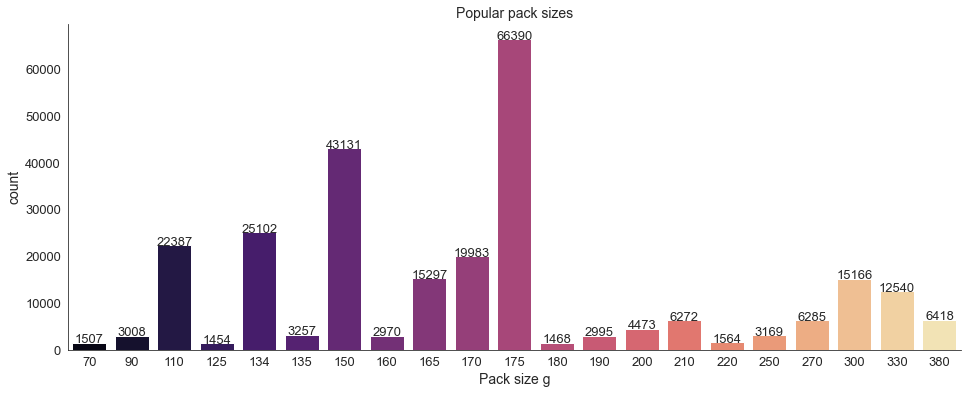
Most popular pack sizes are 175g and 150g.
Brand name
Extract brand name from product name as we did with the weight.
After checking the extracted brand names we will combine some that are the same but written in a different way.
‘Red’ = ‘Red Rock Deli’
‘RRD’ = ‘Red Rock Deli’
‘Old’ = ‘Old El Paso’
‘WW’ = ‘Woolworths’
‘Dorito’ = ‘Doritos’
‘Natural’ = ‘Natural Chip Co’
‘NCC’ = ‘Natural Chip Co’
‘Infzns’ = ‘Infuzions’
‘Snbts’ = ‘Sunbites’
‘GrnWves’ = ‘Sunbites’
‘Burger’ = ‘Smiths’
‘Smith’ = ‘Smiths’
‘French’ = ‘French Fries’
Wrong categories
Let’s find products that are not chips and remove them from our dataset.
Old El Paso Salsa Dips are wrongly categories under chips.
Old El Paso Salsa   Dip Chnky Tom Ht300g    3125
Old El Paso Salsa   Dip Tomato Med 300g     3114
Old El Paso Salsa   Dip Tomato Mild 300g    3085
Woolworth salsas wrongly categorised under chips.
Woolworths Mild     Salsa 300g    1491
Woolworths Medium   Salsa 300g    1430
Doritos salsas wrongly categorised under chips.
Doritos Salsa Mild  300g           1472
Doritos Salsa       Medium 300g    1449
Dip in Smiths brand is just a name for chip flavor, not wrongly categorised so we will keep those.
Smiths Crinkle Cut French OnionDip 150g 1438
Product quantities
After exploring in which quantities chips are bought we find an outlier on 2 records with 200 units bought each time. These to purchases are from the same customer and they don’t have any other records over the year. This could mean they are not a regular consumer and might be buying chips for commercial purposes. We will remove this customer’s records from our dataset.
| DATE | STORE_NBR | LYLTY_CARD_NBR | TXN_ID | PROD_NBR | PROD_NAME | PROD_QTY | TOT_SALES | weight | brand | |
|---|---|---|---|---|---|---|---|---|---|---|
| 69762 | 2018-08-19 | 226 | 226000 | 226201 | 4 | Dorito Corn Chp Supreme 380g | 200 | 650.0 | 380 | Doritos |
| 69763 | 2019-05-20 | 226 | 226000 | 226210 | 4 | Dorito Corn Chp Supreme 380g | 200 | 650.0 | 380 | Doritos |
Most popular brands
Most popular brands overall are Kettle, Smiths, Doritos and Pringles in total appearing in 50% of transactions.
Combine transaction and customer data
We combined customer and transaction data by loyalty card number to understand from which customers segments our transactions are from.
We now have a datatable with 249,668 records and 12 columns.
Now that we are done with preprocessing our dataset and doing some high level analysis, let’s move on to exploring the sales and customer segments more closely.
Exploring sales
Data analysis and customer segments
Defining metrics:
- total sales
- drivers of sales
- where the highest sales are coming from
- chips bought per customer by segment
- average chip price by customer segment
Number of customers in each segment
We have 71,517 unique customers in total.
Premiums in lifestages:
Prominently budget groups are older families, young families and new families.
Prominently mainstream groups are young singles/couples, retirees and midage singles/couples.
Most premium customers can be found in older singles/couples and retirees.
Number of transactions in each segment
Most transactions are from budget older families, mainstream retirees and mainstream young singles/couples.
Lifestage:
21% of all transactions are from customers in older singles/couples lifestage.
19% from retirees.
18% from older families.
16% from younger families.
14% from young singles/couples.
9% from midage singles/couples.
and 3% from new families.
In total that means 58% of all transactions are from older people.
Sales in each segment
Top sales are coming from:
budget - older families
mainstream - young singles/couples
mainstream - retirees
High sales from mainstream young singles/couples and mainstream retirees make sense because these are top number of customers in segments. 11% (top #1) of all customers are in mainstream young singles/couples and 9% (top #2) are mainstream retirees.
Budget older families though are only 6% of all customer segment, so their sales are purely driven by how often and how much they buy.
Average number of chips bought per customer
Older families and young families on average buy the most units of chips per person.(over the course of a year)
Average chip price per segment
Average chip prices vary from min 3.67 to 4.06.
In mainstream midage singles/couples and mainstream young singles/couples it seems like customers are choosing chips with slightly higher prices.
Let’s find out if that difference is significant.
Statistical significance in average chip price
Our null hypothesis is that the average price of chips between groups is not significantly different.
We will compare average pack price in midage and young singles/couples mainstream vs budget and premium.
If the resulting p-value is smaller than 0.05 we will reject our null hypothesis and can say there is a significant difference in the average chip price for these groups.
scipy.stats.ttest_ind(mainstream, not_mainstream, equal_var=False)
	Ttest_indResult(statistic=6.72690465676574, pvalue=0.0340566024200332)
Because our p-value is smaller than 0.05 we can say the higher average chip price in given mainstream groups is significant and did not happen by chance.
What is special about mainstream young singles/couples?
Let’s see why this group’s average chip price is higher than in budget and premium.
Every other customer segment had Smiths and Kettle in their top 2 favourite chip brands. Except mainstream young singles/couples who had Doritos brand instead of Smiths.
How likely are mainstream young singles/couples to buy certain brands?
We compared percentages of brands bought in our target group to percentages of brands bought in rest of the customers and compared the difference between those per brand.
Biggest differences in brands:
Mainstream young singles/couples are 23% more likely to purchase Tyrrells than others.
Mainstream young singles/couples are 52% less likely to purchase Woolworths chips.
What about mainstream midage singles/couples?
Biggest differences in brands:
Mainstream midage singles/couples are 16% more likely to purchase Kettle than others.
Mainstream midage singles/couples are 43% less likely to purchase Sunbites chips.
Pack sizes
Mainstream midage and young singles/couples have a slightly higher mean in pack sizes bought compared to their premium and budget groups, but median is 170g between all.
Conclusion
Top sales are coming from:
- Budget - older families
- Mainstream - young singles/couples
- Mainstream - retirees
High sales from mainstream young singles/couples and mainstream retirees make sense because these are top number of customers in segments. 11% (top #1) of all customers are in mainstream young singles/couples and 9% (top #2) are mainstream retirees.
Budget older families though are only 6% of all customers, so their sales are purely driven by how often and how much they buy.
Most units of chips on average per person are bought by older families and young families.
Average chip prices vary from 3.67 to 4.06.
Mainstream midage singles/couples and mainstream young singles/couples customers are buying chips with slightly higher prices than others.
We looked into those groups more closely and found some preferences in brands.
Mainstream young singles/couples are:
23% more likely to purchase Tyrrells than others.
52% less likely to purchase Woolworths chips.
Mainstream midage singles/couples are:
16% more likely to purchase Kettle than others.
43% less likely to purchase Sunbites chips.
Because these groups are willing to pay more per pack of chips and have preferences with certain brands, we could recommend raising visibility of Tyrrells and Kettle chips by putting them in areas where everyone goes through, like the entrance and checkout.